The benchmark indices lost ground for the first time in last seven consecutive sessions, with the Sensex falling more than 100 points on Thursday but the Nifty ended the January series with 6 percent gains.
Profit booking in technology, auto, pharma stocks, and PSU banks after the announcement of recapitalisation amount for current fiscal pushed the market lower. However, gains in private banks, metals and infra stocks capped losses.
A sharp rise in oil prices and weak Asian cues due to losses in the US dollar dampened the market sentiment. Also, there was an increase in volatility during the day as traders rolled over their positions to the February series.
The 50-share NSE Nifty managed to hold 11,000-mark amid selling pressure throughout the session, before closing lower 16.30 points at 11,069.70.
In January series, the Nifty rallied 5.65 percent and the Sensex rose 6.5 percent while for the week, frontline indices gained more than 1.5 percent.
"Before Budget announcement on February 1, we can see a further short covering, which can take the Nifty higher towards 11,200. In case of no negative surprise, the Nifty would continue to form a base near 11,000. This uptrend should continue," ICICIdirect said.
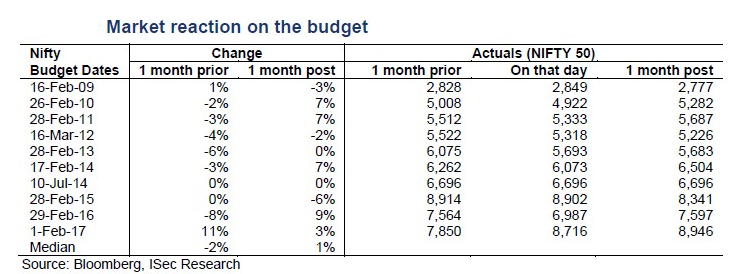
For the upcoming week, the big bang event will be the Union Budget, followed by earnings as well as the auto sales figures. Among global cues, US Fed meet as well as domestic and global data could dominate the Street as well.
The Union Budget & Economic Survey
This is the biggest event for the markets and economy, in general. The government will be presenting the Union Budget 2018 for the next financial year next week.
It assumes significance as it is seen as the last full-fledged Budget in this tenure of Narendra Modi-led BJP government. The Street will watch out for cues from the event, whether populist or reforms-oriented and could see some reactions on that day.
The Budget Session will begin on January 29, 2018, and will end on February 9. The commencement will also see the tabling of Economic Survey. Meanwhile, presentation of the Union Budget by Finance Minister Arun Jaitley will take place on February 1. A second part of the Budget Session will be held from March 5 to April 6, 2018.
Q3 earnings of 465 BSE companies
Along with the Union Budget, there are several major companies that will be declaring their results for December quarter between January 28, 2018 and February 2, 2018.
Companies such as Divi’s Laboratories, Persistent Systems, Century Textiles, Emami, Wockhardt, ICICI Bank, Larsen and Toubro, Oriental Bank of Commerce, IDBI Bank and JSW Steel, among others, will be declaring their results.
Two major index heavyweights will be declaring their results on Monday — Tech Mahindra and HDFC.
The IT services firm is expected to report a profit after tax (PAT) of Rs 775 crore against Rs 836 crore during the previous quarter, a poll of analysts by CNBC-TV18 showed.
Meanwhile, the dollar revenue could rise 2 percent at Rs 1,200 crore against Rs 1,179 crore, while the rupee revenue could rise to Rs 7,760 crore. The company may also report a constant currency growth of 1.8 percent, lower than 2.3 percent in the previous quarter.
Meanwhile, Housing Development Finance Corporation (HDFC) may report a jump in its Q3 net profit of Rs 4,949.1 crore against Rs 1,701.2 crore, according to a poll of analysts by CNBC-TV18 showed. The jump of 190.9 percent is likely to be on the back of post-tax income of Rs 3,675 crore from stake sale in HDFC Life.
IPO
With an intention to raise around Rs 937 crore from its initial public offering (IPO) in its second attempt, Galaxy Surfactants is set to open the issue on January 29, 2018.
MUST READ | Galaxy Surfactants IPO to open on Jan 29: 10 things you should know
The price band for the issue has been set at Rs 1,470-1,480 per share.
The company plans an IPO of up to 6,331,674 equity shares of face value of Rs 10 each for cash.
ICICI Securities, Edelweiss Financial Services and JM Financial Institutional Securities will manage the company’s public issue. The company's equity shares are proposed to be listed on BSE and NSE.
Corporate Action
The Street will watch for a few stocks that will be in focus due to Board-related developments.
For instance, the Boards of Tata Steel and Piramal Enterprises will be meeting on January 31, 2018 for a rights issue. Moreover, companies such as Gayatri Projects, Sundaram Finance, IRB Invit, and eClerx will be in news for a scheme of arrangement as well as a buyback issue. Additionally, the Boards of companies such as HCL Tech, Bharti Airtel, Wipro, JM Financial, and Indiabulls Housing will be meeting to discuss their interim dividend.
Global Cues
The Street will also monitor any developments from the US, where the Federal Reserve will be holding its two-day monetary policy meeting. For now, investors could have factored in a ‘no rate hike’ scenario as it had recently raised it during the December meeting. Having said that, the Fed’s comments and outlook will be watched for cues.
Additionally, moves on the dollar will also be watched. The dollar index has been in a year-long decline, defying forecasts that it should strengthen from the fact that the Federal Reserve is raising interest rates and normalizing monetary policy faster than its counterparts, CNBC reported. But the opposite has happened, and the dollar weakened as flows increased into the euro and yen, as those economies improved, and central bankers in Europe and Japan look closer to removing their own heavy-handed accommodation.
Stocks in Focus
Apart from earnings scenario, a few stocks could be in focus on the back of corporate developments.
Maruti Suzuki Q3 profit up 3 percent; revenue, operational nos in line; cuts royalty payment
Indoco Remedies: The firm's Unit 1 in Goa inspected by USFDA in Jan 2018 received 8 observations
Avenue Supermarts Q3 net profit soars 66 percent to Rs 251.8 crore; revenues rise 23 percent.
LIC Housing Finance: The company’s Q3 net profit has fallen around 2 percent at Rs 491 crore.
JSPL: Net loss for Q3 trimmed to Rs 272.7 crore against Rs 453.3 crore year on year.
Macro Data
Among macro data in India, the annual GDP figures will be out next week along with as well as purchasing managers’ index (PMI) data.
On the global front, Japan will be releasing its industrial production data, along with Europe that will be declaring CPI expectations, among others. The US too will be declaring its employment data, which will be a metric to measure jobs scenario there.
Technical Factors
Bulls failed to keep the momentum going as Nifty50 snapped its 6-day winning streak on Thursday and made a ‘Hanging Man’ kind of pattern on the daily charts.
The index took support at its crucial 5-day’s exponential moving average (DEMA) before bouncing back. The index closed above 11,000 for the third day in a row.
A Hanging Man is a bearish reversal candlestick pattern which is usually formed at the end of an uptrend or at the top. In a perfect 'Hanging Man' pattern either there will be a small upper shadow or no upper shadow at all, a small body and long lower shadow.
“The near-term trend of Nifty as per smaller and larger timeframe is up and still there is no confirmation of any reversal pattern at the highs. Next important resistance to be watched is around 11,115 and 11,300 levels, which are 1.382 percent and 1.618 percent Fibonacci projections,” HDFC Securities said in a report.
It also said that Budget could lead the market for next week, but a top reversal is likely in the next 1-2 weeks. “The confirmation of top reversal pattern from the highs is likely to set the significance of reversal and quantum of expected weakness in Nifty the next couple of weeks,” the report added.
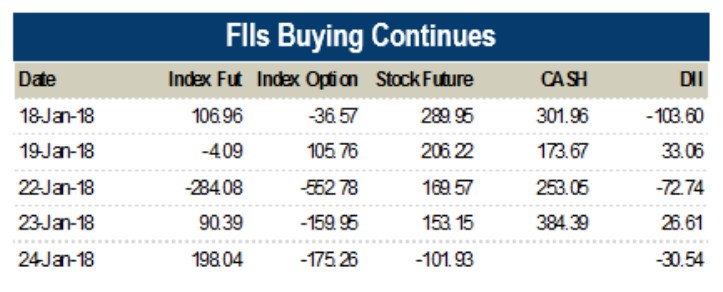
FII Data
The Street will watch out for cues from foreign institutional investors (FIIs). Interestingly, after five consecutive months of being net sellers, they have been net buyers for this month, buying around Rs 9,518 crore worth of shares so far this month.
Meanwhile, domestic investors have been net sellers of Rs 700 crore worth of shares.
Experts have earlier hinted how domestic liquidity has been driving the market ahead. With FIIs joining the party, they had also hinted at further highs on the market.
Oil movement
Crude oil prices touched USD 71 per barrel mark earlier this week, which, in some ways affected the market here. The trajectory of crude movement could likely impact the economy in India going forward, which in turn could affect the market as well.
Oil prices were firmer on Friday after hitting fresh three-year highs in the previous session, as weakness in the dollar continued to underpin prices with crude on track for a weekly gain.
"One has to question if this rally is sustainable. Downside protection is going to be warranted," said Brian LaRose, technical analyst at United-ICAP. Additionally, several experts have also spoken about demand getting reduced as well, which could possibly bring down these prices as well.
Auto sales
The new month will also signal auto sales figures for the month of January. Investors in auto stocks are on their feet, with the Nifty auto index falling over 1 percent. All major stocks have ended in the red, with auto ancillaries falling the most.
MORE WILL UPDATE SOON!!