Showing posts with label S&P 500. Show all posts

Thursday, 28 December 2017

E-mini S&P 500 Index (ES) Futures Technical Analysis – December 28, 2017 Forecast

Based on Wednesday’s close at 2685.50 and the earlier price action, the direction of the index today is likely to be determined by trader reaction to the Up trending Gann angle at 2687.75 and the down trending Gann angle at 2684.00.

March E-mini S&P 500 Index futures are trading slightly better early Thursday. Yesterday, stock market volume was extremely low so we have to take the price action with a grain of salt. We could continue to see another low volume today as investors prepare for the long holiday week-end.


Daily Technical Analysis

The main trend is up according to the daily swing chart. However, we’ve seen sideways to lower price action since December 18. A trade through 2698.00 will signal a resumption of the uptrend. The main trend will turn down on a move through 2651.75.
The short-term range is 2651.75 to 2698.00. Its retracement zone at 2674.75 to 2669.50 is the first downside target. Since the trend is up, look for a technical bounce on the first test of this area.
The intermediate range is 2622.50 to 2698.00. If 2669.50 fails as support, look for the selling to extend into its retracement zone at 2660.25 to 2651.25.
 

Daily Technical Forecast

Based on Wednesday’s close at 2685.50 and the earlier price action, the direction of the index today is likely to be determined by trader reaction to the Uptrending Gann angle at 2687.75 and the downtrending Gann angle at 2684.00.
Overtaking 2687.75 will indicate the presence of buyers. This could trigger a rally into downtrending Gann angles at 2691.00 and 2694.50. The latter is the last potential resistance angle before the 2698.00 main top.
The inability to overcome 2687.75 will signal the presence of sellers. A move under the downtrending angle at 2684.00 and the uptrending Gann angle at 2682.00 will indicate the selling is getting stronger. This could trigger an acceleration to the downside into the short-term 50% level at 2674.75, a longer-term uptrending Gann angle at 2672.50 and the short-term Fibonacci level at 2669.50.

MORE WILL UPDATE SOON!!

Sunday, 10 December 2017

S&P 500 Price forecast for the week of December 11, 2017, Technical Analysis

The S&P 500 pulled back drastically during the week, but found enough support underneath to turn around and form a hammer by the end of the week as the jobs number was slightly larger than anticipated in America.

The S&P 500 initially fell during the week, but found enough support later to turn things around and form a hammer at the 2650 handle. A break above the top of the candle should send this market to the upside yet again, as I think the market will go looking towards the 2700 level above. A breakdown below the bottom of the candle would be very negative, perhaps looking towards the 2600 level next. A breakdown below there should send the market much lower and towards the 2550 handle. Ultimately, this is a market that is bullish, and you certainly can’t sell, and it almost looks as if it’s ready to go into more of an impulsive move. This would line up with the “Santa Claus rally” that we will quite often see, as money managers try to pad their results for the last 12 months.
If we did breakdown at this point, that would be a very big surprise, as it typically doesn’t happen, and of course the jobs number in America was relatively decent. I think this remains a “buy on the dips” situation going forward, and I certainly don’t have any interest in shorting the S&P 500 as it has been so relentless, and it’s moved to the upside. In general, I believe the stock markets around the world are going to go higher in the S&P 500 will march right along with the rest of them. It looks as if the rally continues over the next several weeks.
   

MORE WILL UPDATE SOON!!

Thursday, 7 December 2017

S&P 500 Price Forecast December 7, 2017, Technical Analysis

The S&P 500 had a choppy session on Wednesday, testing the 2620 handle, but then bouncing to show signs of life again.


The S&P 500 initially fell during the trading session on Wednesday, but found enough support at the 2620 handle again to rally, suggesting that we are going to continue to be very choppy but algorithmic traders seem to be hell-bent on lifting the market. I think eventually we will go looking towards the 2650 handle above, which has been massive resistance. I think pullbacks are helpful in this market though, because we are bit overextended anyway, and I believe that the 2600 level underneath should continue to be massively important for the uptrend. In fact, it’s a bit of a “floor” from what I can see.
If we break down below the 2600 level, then I think the market probably goes down to the 2550 level after that. In general though, I believe that easy money and corporate profits continue to favor the S&P 500 going higher. I think that longer-term, the markets probably go looking towards the 2700 level, but these pullbacks are necessary to build up enough momentum as we had rallied far too far into short of an area. For me, I believe that this market is probably best traded in the options market if you have that ability, perhaps selling premium. However, CFD markets work as well, as you can use small positions to bet on the upside as we see plenty of interest in this market every time it dips. The algorithmic traders have been a major driver of the S&P 500, and even though we are a bit overstretched, at this point it looks as if selling pressure simply cannot last for very long.

MORE WILL UPDATE SOON!!

Wednesday, 6 December 2017

S&P 500 Price Forecast December 6, 2017, Technical Analysis

The S&P 500 had a slightly positive session on Tuesday, as we continue to dance around the 2650 level. The uptrend seems to be very much intact.

The S&P 500 rallied during the trading session on Tuesday, reaching towards the 2650 level again. We had fallen on Monday to fill the gap, and now it appears that the gap is going to hold as support for the longer-term move. Because of this, a break above the 2650 level should send fresh money into the marketplace, looking for a breakout to the upside yet again. At this time of year, you quite often get the “Santa Claus rally”, which is simply larger money managers trying to buy stocks to show clients that they are in fact invested in something. Managers that have not done well this year will be chasing returns frantically, to get the right amount of return for their clients to keep the business going.
We have algorithmic trading that is also keeping the market afloat as well, and I think that the machine trading will continue. That being the case, I like buying pullbacks in the S&P 500 but I also recognize that there is a lot of noise in the marketplace, with a lot of focus being on the US Congress passing some type of tax bill. Ultimately, the market should continue to go higher if we get signs of progress. Alternately, if we fail to get that passage, that should be very negative for stock markets. Currently, it looks as if the corporate rate is going to be 20% in the United States, which makes it very competitive with the rest of the world, thereby having the S&P 500 looking cheaper than it did just a few weeks ago. Ultimately, the 2600 level is the “floor” in the uptrend.


MORE WILL UPDATE SOON!!

Tuesday, 5 December 2017

S&P 500 Price Forecast December 5, 2017, Technical Analysis


The S&P 500 gaped higher at the open on Monday, it now seems to be trying to settle at the 2650 handle. This of course is an area that has been resistance, so it’s likely that we will continue to find interest in this area.

The S&P 500 gaped higher at the open on Monday, clearing the 2650 handle. The market rallying to the 2660 level did find a bit of resistance, but eventually we pulled back to test the 2650 level for support. Ultimately, the market should continue to go higher, and then reaching towards the 2700 level. However, if we break down below the bottom of the gap for the day, that would be a very negative sign, perhaps sending this market back down to the 2625 handle. The 2600 level underneath is massive support as well, and essentially where I think that the uptrend ends, least in the short term.
We should see the “Santa Claus rally” soon, which is when fund managers on Wall Street start buying stocks to make it look like they have been doing something all year. It’s called padding the portfolio, and it makes investors happier at the end of the year. This is something that happens quite often, and it looks as if the S&P 500 is ready to continue that tradition. I don’t think we are going to see a massive selloff unless of course we get a failure of tax reform, which right now looks very likely to pass in one form or the other, as the US Senate passed a form of tax reform over the weekend. Late Monday night we will get a resolution vote in the US House of Representatives, and if it moves forward it’s likely that we will have a bill for President Trump to sign in the next week or so.

MORE WILL UPDATE SOON!!

Sunday, 3 December 2017

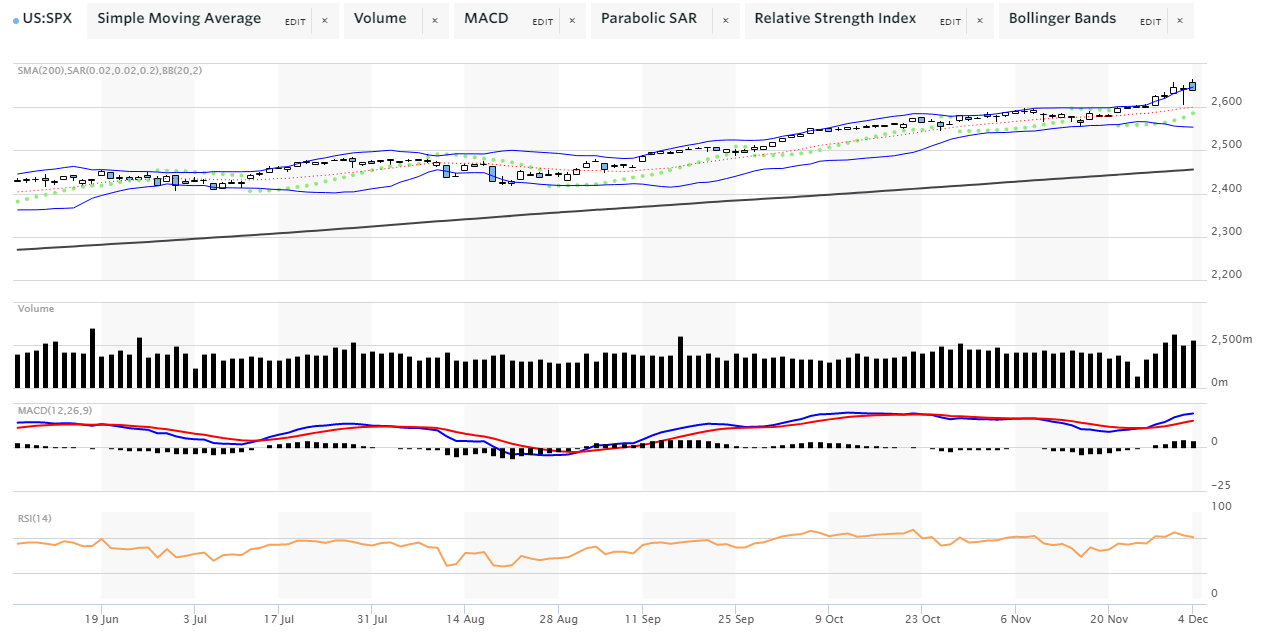
S&P 500 Price Forecast December 4, 2017, Technical Analysis

The S&P 500 showed massive amounts of volatility during the trading session on Friday, and that truly showed itself as General Flynn decided to flip state’s evidence.


The S&P 500 was very volatile during the Friday trading session, and as you look at the hourly chart, you can see that the volatility has extended in both directions, and was getting worse by the end of the day. The massive negative candle formed on the hourly chart was due to General Flynn suggesting that he was willing to testify against the White House, and that sent the markets into a bit of a shock. However, we turned around and gained back most of those losses, and by the end of the day Friday it looks like we are very bullish again. A break above the 2650 level should send this market to the upside, perhaps looking towards the 2700 level. The 2600 level underneath should be massively supportive, and I believe that the market will continue to have a lot of a “buy on the dips” type of mentality. The algorithmic traders continue to take advantage of these pullbacks, as we have not had a proper pullback in ages. Any time we see the market pull back the way it has during the day on Friday, it seems like the buyers are willing to jump in. Friday was no different as you can see.
I believe that the 2600 level underneath should be thought of as a bit of a “floor” in the market, and I think that the general attitude of the market is very bullish, and a break above the 2650 level is possible, even on Monday. However, over the weekend we have a lot of potential for headlines coming out of the news that will cause this market to move quickly, be it up or down.


MORE WILL UPDATE SOON!!