Sunday 7 January 2018

Dow Jones 30 and NASDAQ 100 Price forecast for the week of January 8, 2018, Technical Analysis

The US stock markets rally during the week, even though we had a less than anticipated jobs number coming out of the United States. I think it’s obvious that the stock markets continue to find plenty of bullish pressure, and this week of course would have been when money management came back from holiday to put money to work.


Dow Jones 30

The Dow Jones 30 rallied significantly during the week, breaking above the shooting star from both of the previous weeks. The 25,000-level broken to the upside is a psychologically significant event, and I think that we are going to continue to find buyers jumping into this market longer term. Pullbacks should be buying opportunities, and at this point I think money managers have signal that they are willing to jump into the equities market with both feet this year. I think we are going to see a move to the upside, and I think that given enough time it’s likely that the dips will be bought as well.

NASDAQ 100

When looking at the weekly chart, you can see that we have followed an uptrend line, and have broken above the 6500 level as well. This is a very bullish sign, and I think that the market is ready to go much higher. Breaking above the 6500 level sends fresh money into the marketplace, and it says that we are ready to go to the 6750-handle next. I think that the markets will eventually find reasons to go higher going forward, although the NASDAQ 100 has been a bit of a laggard when it comes to the other US indices that we follow here at FX Empire. Its bullish, but you may get more momentum out of the other indices.
MORE WILL UPDATE SOON!!

S&P 500 Price forecast for the week of January 8, 2018, Technical Analysis

The S&P 500 has rally during the week, breaking above the 2700 level, and more importantly from a technical analysis standpoint, breaking above the top of a shooting star from the previous week and the previous week before that. In other words, this is a very bullish sign.

 
The S&P 500 rallied during the week, slicing through the tops of a couple of shooting stars and the 2700 level. This is a very bullish sign, and I think that the market should continue to go to the upside, perhaps reaching the 2800 level next, and then eventually the 3000 level. The S&P 500 has been explosive during 2017, and it looks as if the continuation is ready to happen. US economic numbers continue to be very bullish, and although the jobs number missed on Friday, it appears that it only dampened spirits to the upside, not killed them.
I think there is more than enough reason to think that dips will be buying opportunities, and we may find the 2700 level to be a bit of a floor. I think that the 2500 level will be a floor, as it is a large, round, psychologically significant number. Ultimately, this is a market that continues to find reasons to go higher, and I don’t see anything on the chart to suggest that it will be anything different as the buyers are likely to look at any pullback as value. Money managers have been coming back from the holidays during the week, and it looks as if they have put money to work yet again. With this, the “long only” fund certainly are starting to push the market again. I suspect that we continue to have a nice longer-term investing opportunity.
MORE WILL UPDATE SOON!!

Nifty Bank Outlook for the Week (Jan 08, 2018 – Jan 12, 2018)

NIFTY BANK:


Nifty Bank closed the week on positive note gaining around 0.20%.
As we have mentioned, last week that minor support for the index lies in the zone of 25400 to 25500. Support for the index lies in the zone of 25000 to 25100 from where the index broke out of triple top pattern. If the index manages to close below these levels then the index can drift to the levels of 24500 to 24600 where break out gap for the index is lying. During the week the index manages to hit a low of 25233 and close the week around the levels of 25602.
Minor support for the index lies in the zone of 25400 to 25500. Support for the index lies in the zone of 25000 to 25100 from where the index broke out of triple top pattern. If the index manages to close below these levels then the index can drift to the levels of 24500 to 24600 where break out gap for the index is lying.
Resistance for the index lies in the zone of 25900 to 26000 where the index has formed a top in the month of November-2017. If the index manages to close above these levels then the index can move to the levels of 26300 to 26400.
Range for the week is seen from 25100 to 25200 on downside & 26000 to 26100 on upside.


MORE WILL UPDATE SOON!!

Nifty Outlook for the Week (Jan 08, 2018 – Jan 12, 2018)

NIFTY:


Nifty closed the week on positive note gaining around 0.30%.
As we have mentioned last week, that minor support for the index lies in the zone of 10400 to 10450. Support for the index lies in the zone of 10000 to 10100 where medium term moving averages and break out levels are lying. If the index manages to close below these levels then the index can drift to the levels of 9650 to 9700 where 200 daily moving averages and lows for the month of August-2017 and September-2017 are lying. During the week the index manages to hit a low of 10405 and close the week around the levels of 10559.
Minor support for the index lies in the zone of 10400 to 10450. Support for the index lies in the zone of 10000 to 10100 where medium term moving averages and break out levels are lying. If the index manages to close below these levels then the index can drift to the levels of 9650 to 9700 where lows for the month of August-2017 and September-2017 are lying.
Resistance for the index lies in the zone of 10600 to 10700 where trend-line joining highs formed in the month of September-2016 and August-2017 is lying. If the index manages to close above these levels then the index can move to the levels of 10900 to 11000.
Broad range for the week is seen from 10300 on downside & 10800 on upside.


MORE WILL UPDATE SOON!!

Market Week Ahead: Infosys and TCS earnings, macro data among 10 things to keep investors busy

Blue-chip companies like Infosys, TCS and IndusInd Bank will announce its Q3 numbers in the coming week.

It was a good start to the year 2018 as benchmark and midcap indices ended the week at fresh record closing high despite higher crude oil prices, driven by positive global cues and progress on PSU bank recapitalisation. Also, hopes of government meeting its FY18 fiscal deficit target of 3.2 percent of GDP boosted sentiment.
The 50-share NSE Nifty settled the weekly session at 10,558.85, up 0.3 percent and the 30-share BSE Sensex rose 0.3 percent to 34,153.85 while the broader markets outshone frontline indices, with the Nifty Midcap rising 1.7 percent.
The market has been trading at premium valuations due to consistent liquidity support and hopes of earnings recovery going ahead.
The positive momentum amid volatility is expected to continue in the coming week as well, but the move is likely to be largely dependent on corporate earnings season that will be kickstarted by TCS, Infosys and IndusInd Bank.
Expectations from Union Budget 2018, which will be presented in the Parliament on February 1, may also keep market volatile. Hence, both these events may point towards more stock specific action in the coming week, according to experts.
"The Budget will create volatility and lots of noise but fundamental solid policy change matters a lot to the direction of the economy and inflation and is therefore important for the markets," Madhav Dhar, Managing Partner of GTI Capital Group, said in an interview to CNBC-TV18.
Vinod Nair, Head Of Research at Geojit Financial Services, said the market was wary of a populist Budget since this is last one before general elections. In the immediate future, market will look for more Budget related cues and as per progress of Q3 results season, he added.
In recent times, higher oil prices, rising inflation and RBI's hawkish stance have been ominous for the market, Nair said.
Here are 10 key factors that keep investors busy next week:-
Earnings
The December quarter earnings season will see the Q3results of blue-chip companies like Infosys, TCS and IndusInd Bank in the coming week.
Generally, corporate numbers are an important indicator of economic growth. After steady earnings recovery in Q2FY18, most analysts expect the second half of FY18 (Q3 and Q4) to give clear directions for FY19 earnings.
The earnings recovery momentum is likely to accelerate in Q3FY18. We estimate PAT of our 230 coverage companies to grow 14 percent YoY (first half of FY18: 2 percent). Unlike previous quarters, earnings growth is likely to be more broad-based.
Key things to track include: a) hit on banks’ treasury income (owing to higher interest rates); b) impact of higher commodity prices on gross margins of consumer companies; c) GST related issues; and d) FX impact on export-oriented sectors such as, IT and pharma, it added.
Infosys
The country's second largest software services provider will announce its first quarterly earnings under newly appointed CEO & MD Salil Parekh on January 12.
Ovearll IT earnings for Q3FY18 are expected to be impacted by furloughs and holiday season but as major global currencies were fairly stable during Q3FY18, currencies are not expected to materially affect revenue growth or margins, Edelweiss said.
Brokerage houses expect Infosys to report revenue growth at around 1-1.5 percent. Impact of weakness in revenue growth for the company would be offset by operational efficiencies.
Kotak expects Infosys to maintain guidance of 5.5-6.5 percent constant currency revenue growth and 23-25 percent EBIT margin.
For all IT companies’ earnings, Edelweiss said it would keenly monitor: 1) Infosys’ strategic roadmap post appointment of new CEO, Salil Parekh; 2) demand commentary in BFSI & retail 3) clients’ budget & pricing in legacy business; 4) traction in digital services; and 5) pace of local hiring in US.
TCS
Tata Consultancy Services, the country's largest IT services provider, will declare its earnings on January 11. Analysts largely expect company's revenue growth at around 1 percent for the quarter.
Revenue growth to be impacted due to sustained softness in BFSI and Retail, while rest business will continue good momentum. EBITDA margins expected to contract by 30bps QoQ on account of seasonal furloughs.
Commentary on client budgets, spends by BFSI and retail clients are key monitorables, it added.
IndusInd Bank
IndusInd will be the first to announce third quarter earnings among largecap banks on January 11. It is likely to give some directions to earnings of other banks.
Largely it is expected to be soft quarter for banks due to softer revenue momentum and elevated credit costs, Edelweiss said, adding earnings of retail-heavy private banks are expected to be stable while corporate-heavy banks are likely to incur elevated credit costs (ageing provisions, provisions on accounts referred to NCLT by RBI).
In case of IndusInd, Kotak expects limited asset-quality stress but divergence, if any, could be reported this quarter. Progress on Bharat Financial acquisition is likely to be discussed, it feels.
The research house expects loan growth at 24 percent YoY, led by steady growth in retail business. NIM will remain stable QoQ supported by higher share of retail loans, it feels.
Macro Data
The data for November industrial production and December CPI inflation will be released after market hours on Friday.
The retail inflation measured by the Consumer Price Index for November had increased to a 13-month high of 4.88 percent, from 3.58 percent in October, mainly due to increase in food and oil prices, while India’s industrial output slowed to 2.2 percent in October as compared with 3.8 percent a month ago.
Foreign exchange reserves data for the week ended January 5 will also be announced on Friday while balance of trade data will be declare on Wednesday.
Crude
Brent crude futures, the benchmark for international oil prices, crossed USD 68 a barrel level for the first time since May 2015 is the key risk for country like India which imports more than 80 percent of oil requirement.
Brent crude futures settled the week below that level, at USD 67.62 a barrel. Experts expect the crude can hit USD 70 a barrel, which is still manageable for India but beyond that the risk will increase in terms of widening fiscal deficit. Not only economy but also companies that are depend upon on crude.
"Presently, Indian economy is under stable state and can manage till crude prices are below USD 70-72, will alarm concern if it sustains above USD 75 for longer time," Yogesh Mehta, VP- Retail Research, MOSL said in an interview to Moneycontrol.
Technical Outlook
After decisive close above 10,550 for the first time may drive the Nifty above 10,600 level but beyond that it needs strong cues (could be in earnings or Budget). After record high levels, some consolidation can't be ruled out, experts suggest. According to them, 10,400 will remain immediate support for the Nifty.
The short term trend of Nifty is positive amidst range bound action. The upper range 10,550-60 levels is placed at the verge of upside breakout, but the upside momentum is not picking up at the highs.
The formation of back to back lacklustre type candle pattern as per weekly timeframe is not suggesting healthy uptrend at the new highs. Though, there is no confirmation of any reversal pattern at the highs, but the danger of beginning of downward correction from the highs is not ruled out.
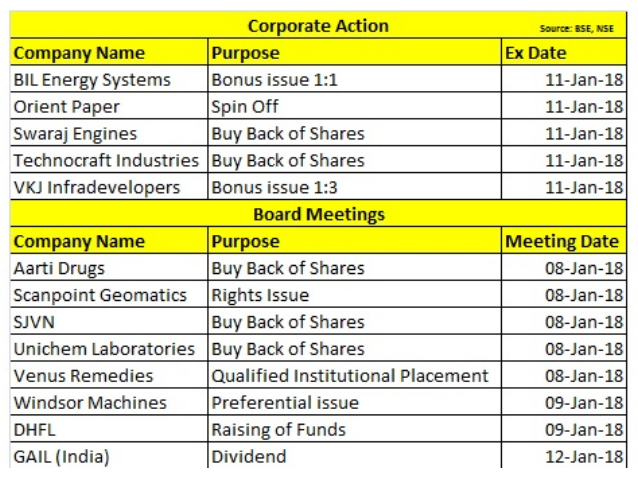
Corporate Action
Stocks in Focus
On Monday, Goa Carbon is expected to react positively to its Q3 earnings. It has posted net profit at Rs 22.50 crore against net loss of Rs 0.93 crore in year-ago and revenue more than doubled to Rs 186.6 crore from Rs 82 crore YoY.
Tata Steel's India production and sales in Q3FY18 were at 3.24 million tonnes and 3.30 million tonnes (provisional data), higher compared with 3.03 million tonnes and 3.08 million tonnes in Q2FY18, respectively. Europe steel production increased to 2.68 million tonnes (provisional) from 2.60 million tonnes but sales declined to 2.41 million tonnes from 2.60 million tonnes YoY.
Uttam Galva Steels reported loss at Rs 179.96 crore for October-December quarter 2017 against loss of Rs 257.28 crore in year-ago and revenue declined sharply to Rs 666.90 crore from Rs 1,035.61 crore YoY.
Sobha during December quarter achieved new sales volume of 9.33 lakh square feet (valued at Rs 750.9 crore) with an average realisation of Rs 8,045 per square feet, which is the highest every quarterly sales performance in terms of value and average realisation. Sales volume increased 8.4 percent and sales value 11.2 percent QoQ; and 52 percent & 92 percent YoY.
Lanco Infratech's shareholding in subsidiary Lanco Kondapalli Power reduced to 28.15 percent from 58.91 percent and hence, lenders' controlling stake stood at 52.21 percent after strategic debt restructuring.
NBCC shares may also react positively as the company has received contract from Ecotourism Development Corporation of Uttarakhand, Dehradun for construction of Kotdwar-Ramnagar Kandi Road amounting Rs 2,000 crore.
NACL Industries said the board of directors approved to raise funds to the tune of Rs 300 crore for meeting its growth plans.
Den Networks has entered into an agreement with cable TV distribution company VBS Digital Distribution Network (VBS) for acquiring 51 percent stake in VBS for Rs 2.64 crore.
Visa Steel is in discussion with SBI for settlement after the SBI filed an application with National Company Law Tribunal Kolkata to initiate corporate insolvency resolution process for the company under Insolvency & Bankruptcy Code.
Global Cues
Europe's industrial sentiment for December and retail sales for November will be announced on Monday, followed by unemployment rate for November on Tuesday.
China's December CPI and US' gasoline production will be released on Wednesday while Europe's industrial production for November and US' initial jobless claims will be announced on Thursday. European Central Bank will also publish account of monetary policy meeting on Thursday.
US' CPI and retail sales data for December will be declared on Friday.
MORE WILL UPDATE SOON!!


Global brokerage firms see Nifty hitting 11,400-11,500 and Sensex 37,000 in 2018

Investors who are looking to enter can either wait for a dip or enter at current levels as the rally is likely to extend towards 11,400-11,500 on Nifty, which translates into an upside of nearly 1,000 points or 9 percent from current level while for the Sensex it could be closer to 37000.


Two global brokerage firms which have come out with their yearly outlook for Indian markets for the year 2018 suggest that the rally in Indian markets is not over yet.
Investors who are looking to enter can either wait for a dip or enter at current levels as the rally is likely to extend towards 11,400-11,500 on Nifty, which translates into an upside of nearly 1,000 points or 9 percent from current level while for the Sensex it could be closer to 37,000.
Indian markets rallied 29 percent in the year 2017 thanks to global and domestic liquidity which helped our markets to climb every wall of worry, but 2018 will be different. Analysts advise investors to trim down their return expectations for the calendar year as the journey will not be smooth.
As we step into 2018, Indian macro picture which was the strongest among other Asian peers looks shaky especially with crude on the rise. The first GDP estimates by CSO last week suggest a slowdown in the economy. Earnings are yet to recover for India Inc.
Data released by CSO last week highlighted that India will likely grow at 6.5 percent in 2017-18, slower than the previous year’s 7.1 percent expansion.
But, even though the economy seems to be slowing down which according to most experts it is a temporary phenomenon. Economists’ expect gross value added (GVA) growth to rise to around 6.6 percent in Q3 FY2018 and a sharp 7.5 percent in Q4 FY2018.
"Our economists expect GDP growth to recover from 6.6 percent in the current fiscal year to 7.5 percent and 7.8 percent over FY19 and FY20, respectively," the report said adding that "we expect Nifty earnings to increase 22 percent in FY19 and 17 percent in FY20,” the Deutsche Bank Research Report on India Equity Strategy said.
"We are setting our year-end December 2018 Nifty target at 11,500 (implied Sensex target of 37,000)," Deutsche Bank said in a research note adding the expectation of double-digit earnings growth forms the keystone of its positive view on the market in 2018.
The report further noted that rising prices of oil beyond the already elevated levels currently could be a key risk factor for India. But, the analysts are watching out for one number and that is earnings growth.
What will drive markets in the year 2018 is the earnings growth of India Inc. which should rise to double digits. History suggests that Nifty delivered a 12 percent annual return in rupee terms over the past five years despite a weak 4 percent corporate earnings CAGR. But, this is about to change, CLSA suggests in a note.
CLSA expects earnings to dramatically improve to a 15-20 percent CAGR over the next two years as corporate earnings return to normal with the bad news already priced in.
However, domestic and international liquidity factors have been quite favourable and the risk is on the downside. CLSA’s December 2018 Nifty target stands at 11,400 which offers a total return of around 10 percent, building in a 10 percent de-rating from the current multiple of 17.9x.
The Nifty currently trades at 17.9x one-year forward earnings and is 16 percent above the past five-year historical average. A strong improvement in earnings growth would be needed to deliver positive market returns, the global investment bank said.
Top nine stock which CLSA is betting on for the year 2018 includes companies like CG Consumer, Godrej Properties, HDFC, ICICI Bank, IndusInd Bank, L&T, Lupin, M&M, and NTPC.
MORE WILL UPDATE SOON!!

Nifty may move towards 10,700 with support at 10,470 ahead of January expiry

The current price ratio (Bank Nifty/Nifty) has been continuously declining from 2.50 to 2.42 levels in the past few weeks. However, the ratio has a decent support near 2.42 levels.

The Nifty was finally able to provide highest weekly closing despite a decline seen towards 10,400 in the past week.
Since the Gujarat election outcome, we have seen a sharp decline in volatility. During this period, the Nifty consolidated above 10400.
The highest Put base of the Nifty has moved from 10300 to 10400 strike, which shows that the momentum is shifting upwards as we are approaching the Union Budget.
Various under performing sectors have started performing due to the closure of short positions. This is particularly so for stocks from sectors like capital goods, cement and metals that are somehow related to the likely announcements to be made in Budget on infrastructure and rural development.
The Nifty future premium has declined to 26 points from the last series 55 points, which shows that market participants are still skeptical before the February event.
They have formed short positions in Nifty futures either speculatively or to hedge their long positions. This could lead to more short covering as we approach the current expiry.
The pullback seen in banking stocks on account of recap announcement has also pushed the Nifty into some momentum.
Bank Nifty: Index well placed to move towards sizeable Call base of 26000
The index consolidated in a narrow and tight band for a major part of the week. However, a statement by the Finance Minister to seek Parliament approval to issue recap bonds to the tune of Rs 80,000 crore went down well with market participants after which short covering was seen in PSU banks and provided required thrust to the index.
Axis Bank along with other midcap banks continued their northward journey. However, profit booking in HDFC Bank and Kotak Mahindra Bank kept the index move in check. Volatility continued to decline, providing more confidence to options writers.
Call open interest has shifted to higher strike from 25500 and 25700 strikes whereas open interest concentration remained high in 25500 Put.
Since the past two weekly expiries, additions continued in 25500 Put indicating major short-term support. However, in case of any major sell-off, selling is likely to get arrested near 25300.
The current price ratio (Bank Nifty/Nifty) has been continuously declining from 2.50 to 2.42 levels in the past few weeks. However, the ratio has a decent support near 2.42 levels.
We feel outperformance in banking stocks can be seen in coming weeks, which will take the ratio towards 2.46 levels
The first week of 2018 registers inflows in most EMs:
While trading action remained thin at the start of 2018, the initial price and fund flow into EMs continue to portray a positive set-up. MSCI EM index has moved up over 3 percent to 1192 (its highest level since June 2011).
This has been mainly aided by a soft US dollar, bond yields and the firmness in the commodity complex. Fund flow wise, South Korea and Taiwan led the pack with inflows of USD 1.32 billion and USD 718 million, respectively.
Other EMs also saw inflows wherein Malaysia saw inflow of over USD 170 million and India of over USD 100 million
In the F&O space, FIIs toned their bearish bets. Foreign investors (FIIs) covered shorts to the tune of USD 273 million in index futures while stock futures short covering totalled USD 45 million.
Yield differentials among global and emerging markets would remain key in 2018 as tightening global yields on the back of major central bank’s hawkish stance could see outflows pressure on EMs.
Inflation & growth in developed economies in 2018 will be key catalysts as we tread through 2018. With risk-on sentiment continuously gaining traction in equity and bond markets, the focal point becomes the US dollar.
A move below 90 on dollar index has the potential to push the bond market into a more attractive zone (a dollar index move below 90 is only likely to be triggered by a strong contraction in rate hike expectations). A weak dollar environment is likely to be accretive for EMs.
MORE WILL UPDATE SOON!!


DuPont analysis: These 4 stocks gained over 500% in the last three years

DuPont analysis -- an increasing operating profit margin, an increasing asset turnover, and a decreasing asset-to-equity ratio.

Picking stocks to invest in could be tricky at times, particularly when there are tips flying around left, right and centre. There are many aspects one must ideally consider before settling on a scrip to invest in because rushing in blindly to where the light is shining the brightest may not always pay off.
A DuPont analysis is one of the most apt indicators to go by when it comes to picking stocks because it gives you the exact return on equity (RoE) for a particular stock. In order to do so, it combines three of the most important parameters that pertain to the profitability of a company -- operating profit margin, operational efficiency (based on total asset turnover), and financial leverage (based on ratio of total assets to equity).
However, a DuPont analysis is only a tool of measure and does not exactly spell out which stock is worth investing in. 
An increasing operating profit margin indicates that a company is making more today for the same amount of products sold than it was making earlier, while an increasing asset turnover is indicative of improving profitability of a company as a whole. A decreasing asset-to-equity ratio indicates that a company is less dependent on debt than it was before.
Although there are many companies who reported an increase in their return on equity over the last three years, only 15 managed to do so while meeting all three above-mentioned criteria. And not surprisingly, 13 of these stocks have returned between 100 and 970 percent over the last three years.
Among these 13 stocks, COSYN, Maithan Alloys, Associated Alcohols and Vakrangee led the pack with gains of over 550 percent.

Of the 15 companies that passed our filters, there were four IT companies -- 8K Miles Software Services, COSYN, Onward Technologies and Vakrangee -- and three auto ancillary companies -- GP PetroleumsHarita Seating SystemsInvestment & Precision Castings.


MORE WILL UPDATE SOON!!

FPI inflows on course for a record, may jump 5-fold in FY18

Foreign Portfolio Investors (FPIs) had pumped in Rs 48,400 crore or USD 7 billion into the domestic equities in FY17 and this is set to witness a four-five-fold increase in the year to March at USD 28-35 billion.


On a day when the key indices scaled new life-time highs on strong inflows, a research report has said foreign portfolio investors are on course to pump in a record USD 28-35 billion by March — which is a four- five-fold spike over FY17.
The benchmark indices-Sensex and the Nifty-has scaled 28 per cent in the calendar year 2017 over 2016 and since then the markets scaled new peaks in the first week of the new year with both the indices closing at new lifetime peaks with today being another record close.
Foreign Portfolio Investors (FPIs) had pumped in Rs 48,400 crore or USD 7 billion into the domestic equities in FY17 and this is set to witness a four-five-fold increase in the year to March at USD 28-35 billion.
We expect net inflows to be Rs 1.8-2.2 trillion (USD 28-35 billion) for FY18. Already they have pumped in Rs 95,600 crore (USD 15 billion) in the first half of this fiscal, against Rs 48,400 crore (USD 7 billion) for the entire FY17," domestic rating agency Icra said in a report today.
According to Icra senior vice president Karthik Srinivasan, FPI investments in the current fiscal are driven by the debt segment which received a net inflow of Rs 1.17 trillion in the April-November period with positive net inflows across all months.
Supported by healthy inflows, the utilisation of the FPI investment limit in G-secs and corporate debt increased in the current fiscal year despite an enhancement in the permissible investment limits," Srinivasan said.
The equity segment, however, witnessed a net outflow of FPI investments in the August-September period amidst concerns on earnings growth, rising valuations and slowing growth," he added.
The report noted that while the enhancement in FPI limits has reinvigorated the pace of inflows into the debt market, the trend is expected to moderate in the coming months, given the high utilisation levels for G-secs and corporate bonds.
However, it observed that the recent rate hike by the US Fed in December 2017, the ongoing balance-sheet trimming by the US government and the passage of the Tax Cuts & Jobs Act of 2017 have pushed up US treasury yields.
This has in turn contributed to a spike in yields for domestic debt securities, which would help to maintain their relative attractiveness for international investors. Icra expects the debt segment to register net FPI inflows of Rs 1.5-1.6 trillion (USD 24-26 billion) in 2017-18.
The agency expects Rs 27,000-59,000 crore (USD 4-9 billion) of FPI flows into equity in 2017-18, noting that such inflows would remain dependent on the pace of economic growth and the strength of the recovery in corporate earnings.
Meanwhile, the report said the number of FPI registrations with the Securities and Exchange Board has surged in the past couple of years, with over 4,500 FPIs registered between April 2016 and October 2017 including 1,064 in the current fiscal.
This increase in FPI registration largely stems from the regulatory compliance requirements following the introduction of the new FPI regulations in FY 2015," the report said.
Migration of FPIs from 'deemed FPIs' to 'registered FPIs' status, and healthy investment inflows this year augers well and reflects international investors sustained interest in the domestic markets.
MORE WILL UPDATE SOON!!